

Written by: Amin Ghalebi
Author experience: Trading since 2017
Originally published: April 9, 2025
Fact-checked and updated: July 27, 2026
Volume Profile shows trading activity at different prices within a selected period. Instead of asking only when volume increased, it answers where the market did the most and least business. TradingView’s basic-concepts guide documents the calculation and standard terminology.
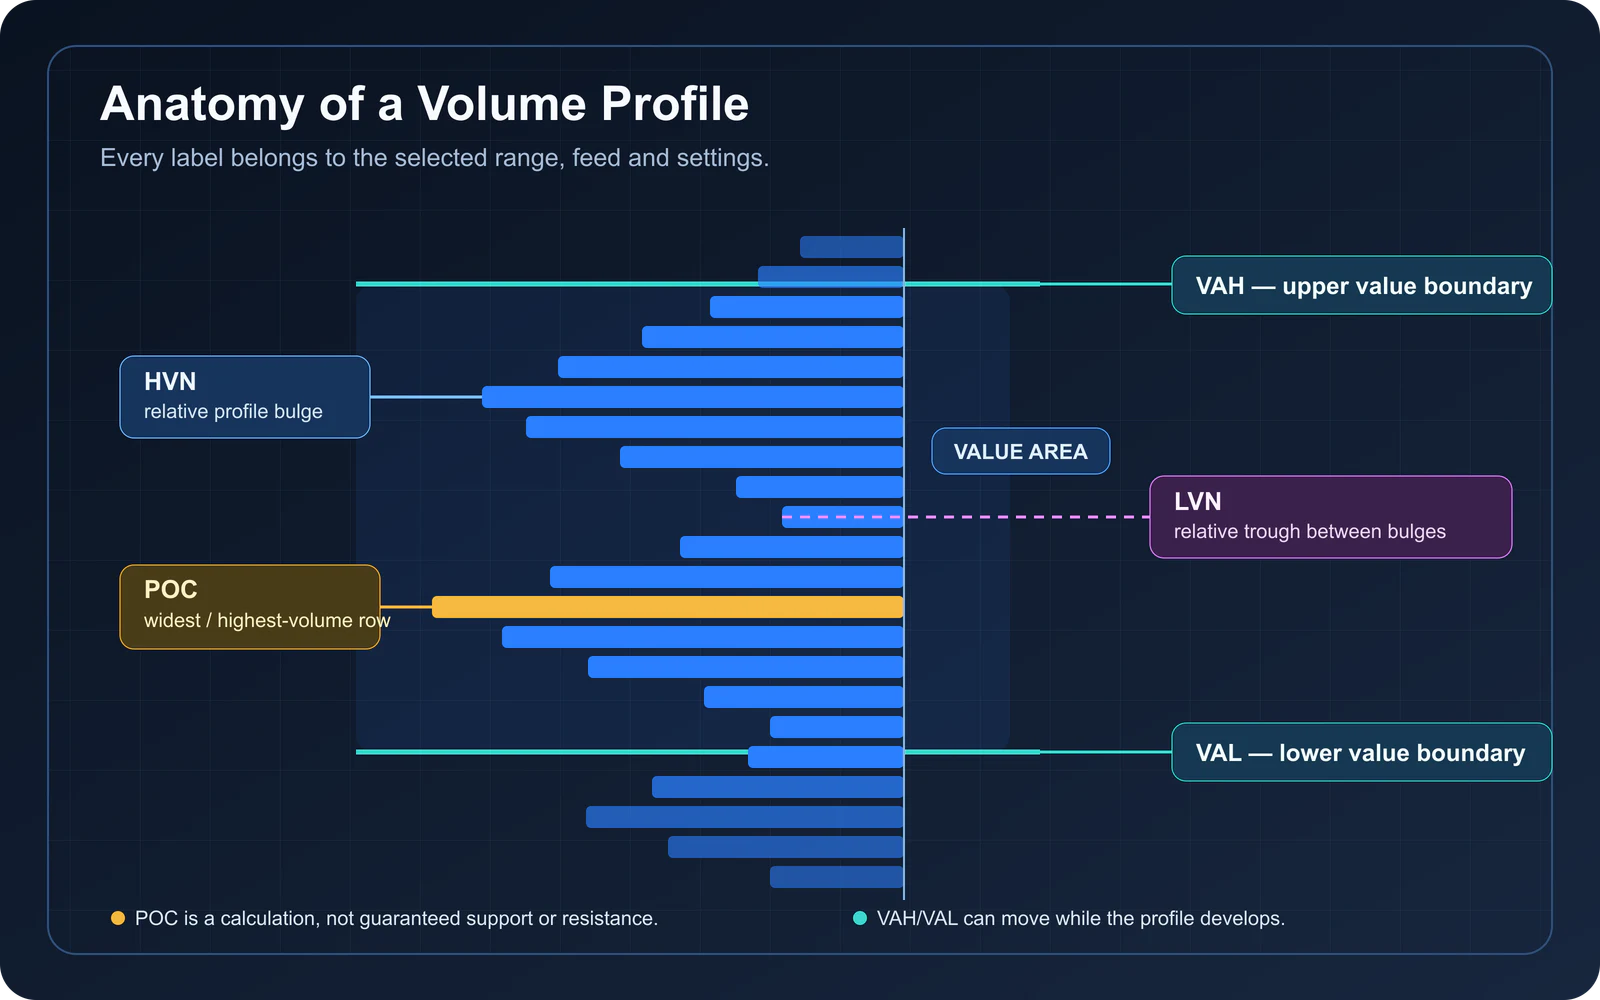
The widest row is usually the Point of Control (POC). The Value Area High (VAH) and Value Area Low (VAL) mark the upper and lower boundaries of a configurable value area. Peaks and valleys elsewhere in the distribution are commonly called High Volume Nodes (HVNs) and Low Volume Nodes (LVNs).
These levels describe past activity; they do not predict price. Volume Profile cannot identify direction, prove institutional buying or supply a universal strategy. Its value comes from combining market context with a repeatable entry, invalidation and risk process.
Educational content only: The setups below are research frameworks, not personalized recommendations. Trading can result in losses, especially when leverage is involved. See the full methodology and risk disclosure.
Table of contents
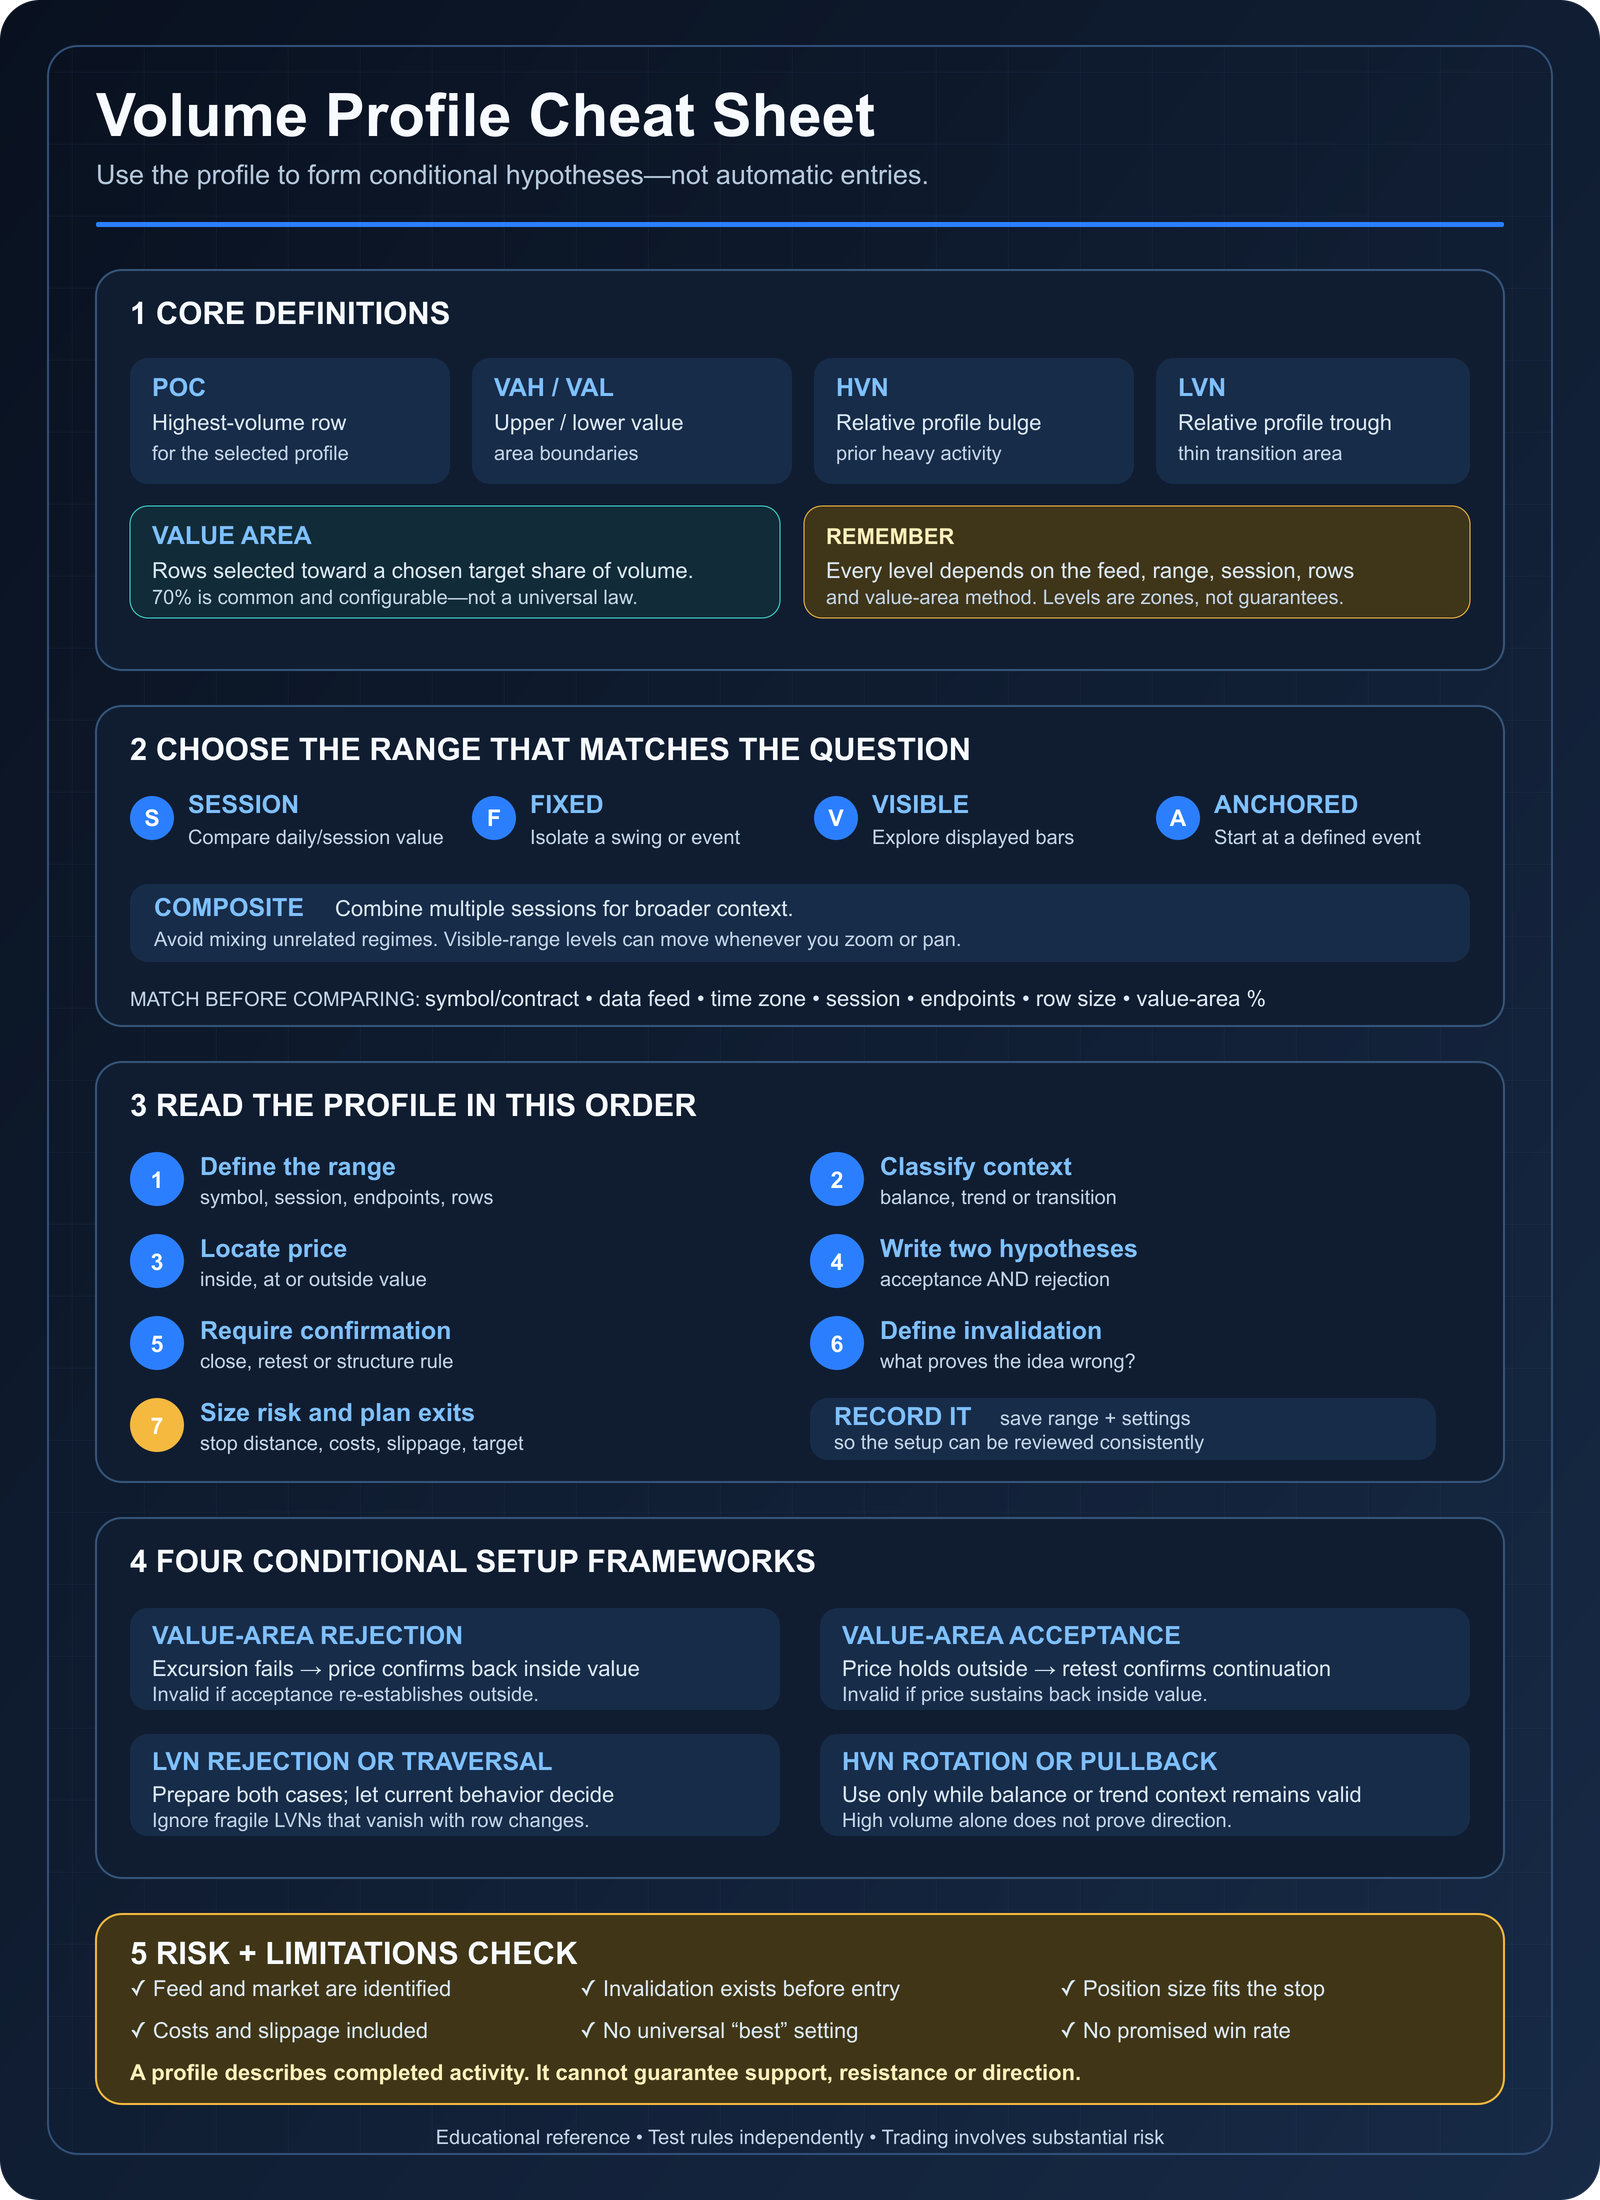
- Volume Profile cheat sheet
- What is Volume Profile?
- How Volume Profile is calculated
- POC, VAH, VAL, HVN and LVN
- Types of Volume Profile
- Best Volume Profile settings
- How to read Volume Profile
- Volume Profile trading strategies
- D, P, b and B profile shapes
- Futures, stocks, forex and crypto
- Platform guidance
- Volume Profile comparisons
- Mistakes and limitations
- Frequently asked questions
Volume Profile cheat sheet
Use this table as a quick reference, then read the detailed sections before applying any level to a trade.
| Term | Plain-English meaning | Useful question | Important limitation |
|---|---|---|---|
| Volume Profile | Volume distributed across price rows for a selected range | Where did the market transact most and least? | Results depend on the data, range, sessions and row size |
| POC | The profile row with the most volume | Where was the strongest historical concentration? | It is not automatically support, resistance or a “magnet” |
| Value area | A contiguous price range calculated around the POC using a chosen target share of profile volume | Where was activity concentrated around the POC? | 70% is common, but configurable and not universal |
| VAH | Upper boundary of the value area | Is price accepting above value or rejecting back inside? | The level can move while the profile develops |
| VAL | Lower boundary of the value area | Is price accepting below value or reclaiming it? | Treat it as a zone, not an exact guaranteed turning point |
| HVN | A relative bulge or peak in the profile | Is price entering an area of prior heavy activity? | No standard threshold defines every HVN |
| LVN | A relative trough between volume concentrations | Is price testing a thinly traded transition zone? | Price can reject, pause or move through; context decides |
| Developing profile | A profile still receiving new trades | How is value changing during the session? | POC, VAH and VAL can move as new volume arrives |
| Fixed-range profile | A profile between manually selected start and end points | What happened inside this specific swing or event? | A different range can produce different levels |
| Visible-range profile | A profile calculated from bars currently visible on screen | What does the displayed chart window emphasize? | Zooming or panning can change every level |
Download the high-resolution Volume Profile cheat sheet
What is Volume Profile?
Conventional volume bars are arranged along the horizontal time axis. Each bar reports the activity associated with a candle or time interval. Volume Profile reorganizes activity along the vertical price axis. Each horizontal row represents the activity assigned to a price or price band within the selected range. TradingView documents conventional bar volume separately in its Volume indicator guide.
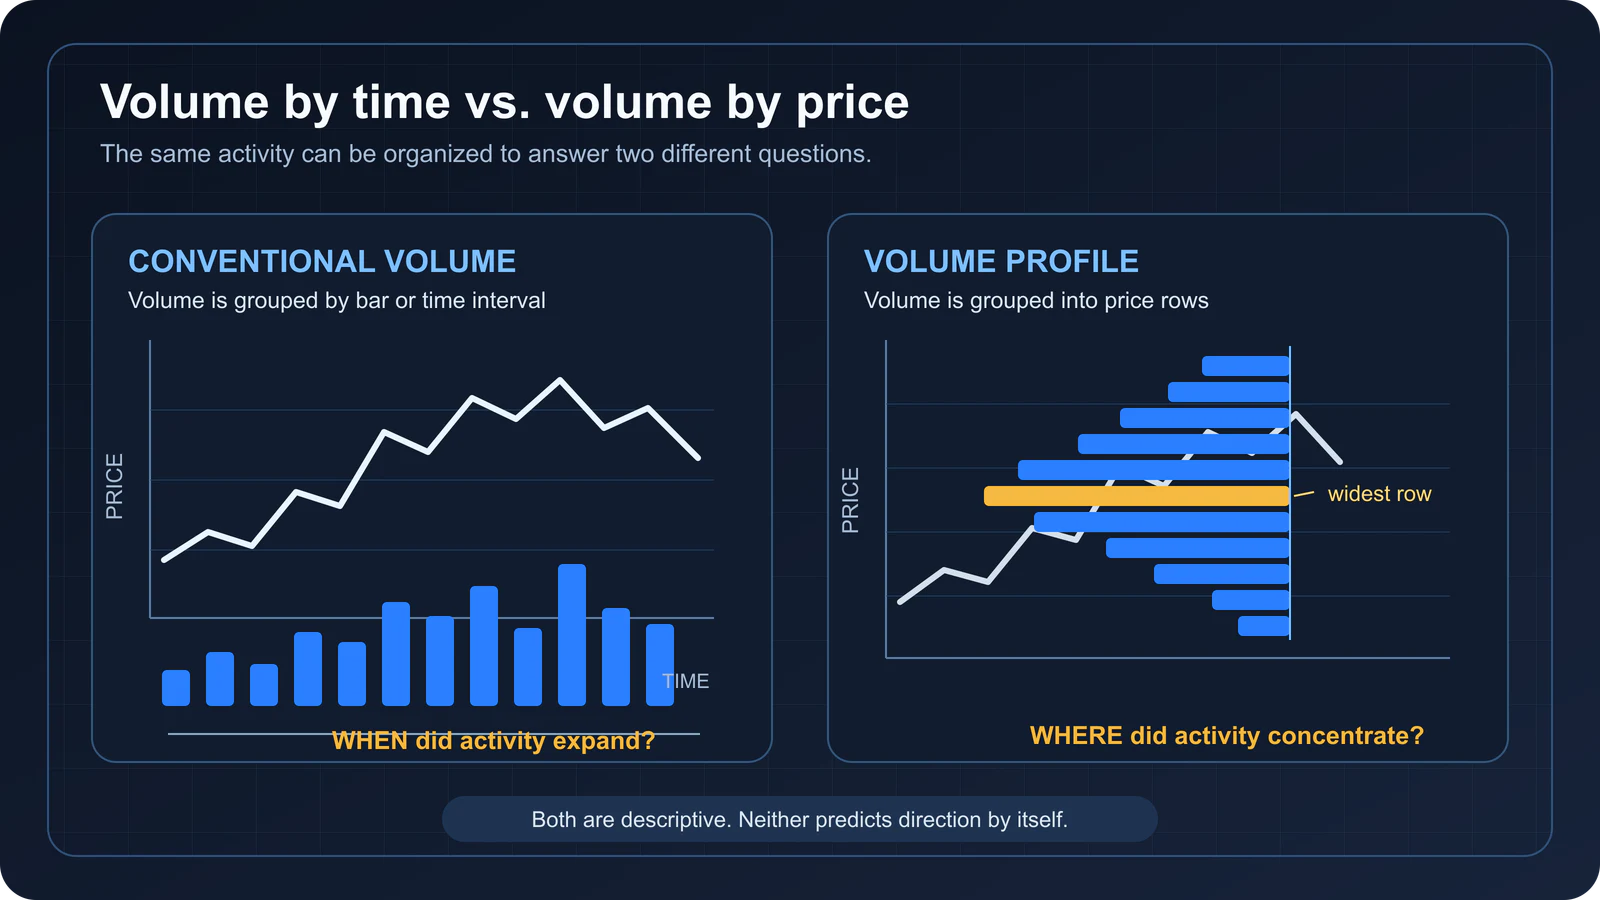
This distinction is simple but important:
- Volume by time: When did activity expand or contract?
- Volume by price: At which prices did activity concentrate or thin out?
The profile is descriptive. Total volume does not identify whether buyers or sellers were “in control”; every completed trade has both. CME Group explains that volume alone cannot show whether positions were opened or closed. At VAH, price may hold above, trade through or reject below. That response matters more than the historical line alone.
How Volume Profile is calculated
At a high level, the indicator performs four jobs:
- Select the trades or bars inside a defined range.
- Divide the price range into rows or bins.
- Assign volume to those rows using the available data resolution.
- Draw a horizontal histogram and calculate optional statistics such as POC and value area.
With tick-by-tick data, a platform can assign each reported trade to its actual price. With lower-resolution candle data, the platform may need to estimate how a candle’s volume was distributed across its high-low range. That approximation is one reason profiles from two feeds or platforms may not match exactly, as documented by Sierra Chart and TradingView.
Fine rows preserve detail but can be noisy; broad rows can hide structure. Changing row size can move the POC and reshape apparent nodes.
How the value area is built
The value area is not the middle of the chart by price. A common algorithm starts at the POC and expands outward toward a chosen target share of total profile volume. Exact inclusion, stopping, grouping, tie-breaking and rounding rules vary by implementation.
TradingView and Thinkorswim document 70% as a typical or default setting, while NinjaTrader defaults to 68%; all make it configurable. The percentage is a convention, not a law of markets. Check the implementation before comparing levels.
Why two Volume Profiles can disagree
Differences usually have a technical explanation:
- Different data feeds or missing historical data
- Tick-level calculation versus minute- or daily-bar approximation
- Different profile start and end points
- Regular trading hours versus extended hours
- Exchange time zone, local time zone or session-template differences
- Different row sizes, number of rows or automatic binning
- Different value-area percentage, rounding or tie-breaking rules
- Futures contract selection and rollover methodology
- Venue-specific stock, forex or crypto data
- Nonstandard candles such as Heikin-Ashi, Renko or range charts
Before concluding that one platform is “wrong,” match the symbol, contract, time zone, session, range, data depth, row size and value-area settings. Sierra Chart’s Volume by Price documentation provides a particularly detailed discussion of calculation and data-resolution differences.
POC, VAH, VAL, HVN and LVN explained
Point of Control (POC)
The POC is the row with the greatest assigned volume. It marks the strongest concentration in that calculation, not necessarily a single trade price. If rows tie, platform rules decide which receives the label.
Prior and developing POCs mark concentrations. A POC may coincide with rotation, support, resistance or no reaction; it needs current structure and a defined trigger.
Value Area High (VAH) and Value Area Low (VAL)
VAH is the highest included row in the value area; VAL is the lowest. Together they bound the rows selected by the platform’s algorithm for the configured value-area target.
“Acceptance” and “rejection” should describe observable behavior. Holding above VAH, building activity and successfully retesting it differs from a brief wick that closes back inside value.
Acceptance and rejection are practitioner labels; no universal number of bars, elapsed time or volume threshold defines either one. A testable strategy must specify those conditions in advance.
Treat the boundaries as zones. Blindly ordering at the printed value ignores spreads, slippage, volatility and calculation differences.
High Volume Nodes (HVNs)
An HVN is a relative bulge where more activity was assigned than to neighboring rows. Practitioners often treat broad HVNs as prior two-way trade or balance, but price may rotate, stop before the node or pass through it.
Low Volume Nodes (LVNs)
An LVN is a relative trough with less activity than neighboring rows. Price can traverse it, reject at its edge or build new activity inside. No standardized threshold defines an LVN; identify it relatively and confirm the response.
Types of Volume Profile
The chosen range defines the question the profile answers. A technically correct calculation can still be irrelevant if it covers the wrong period.
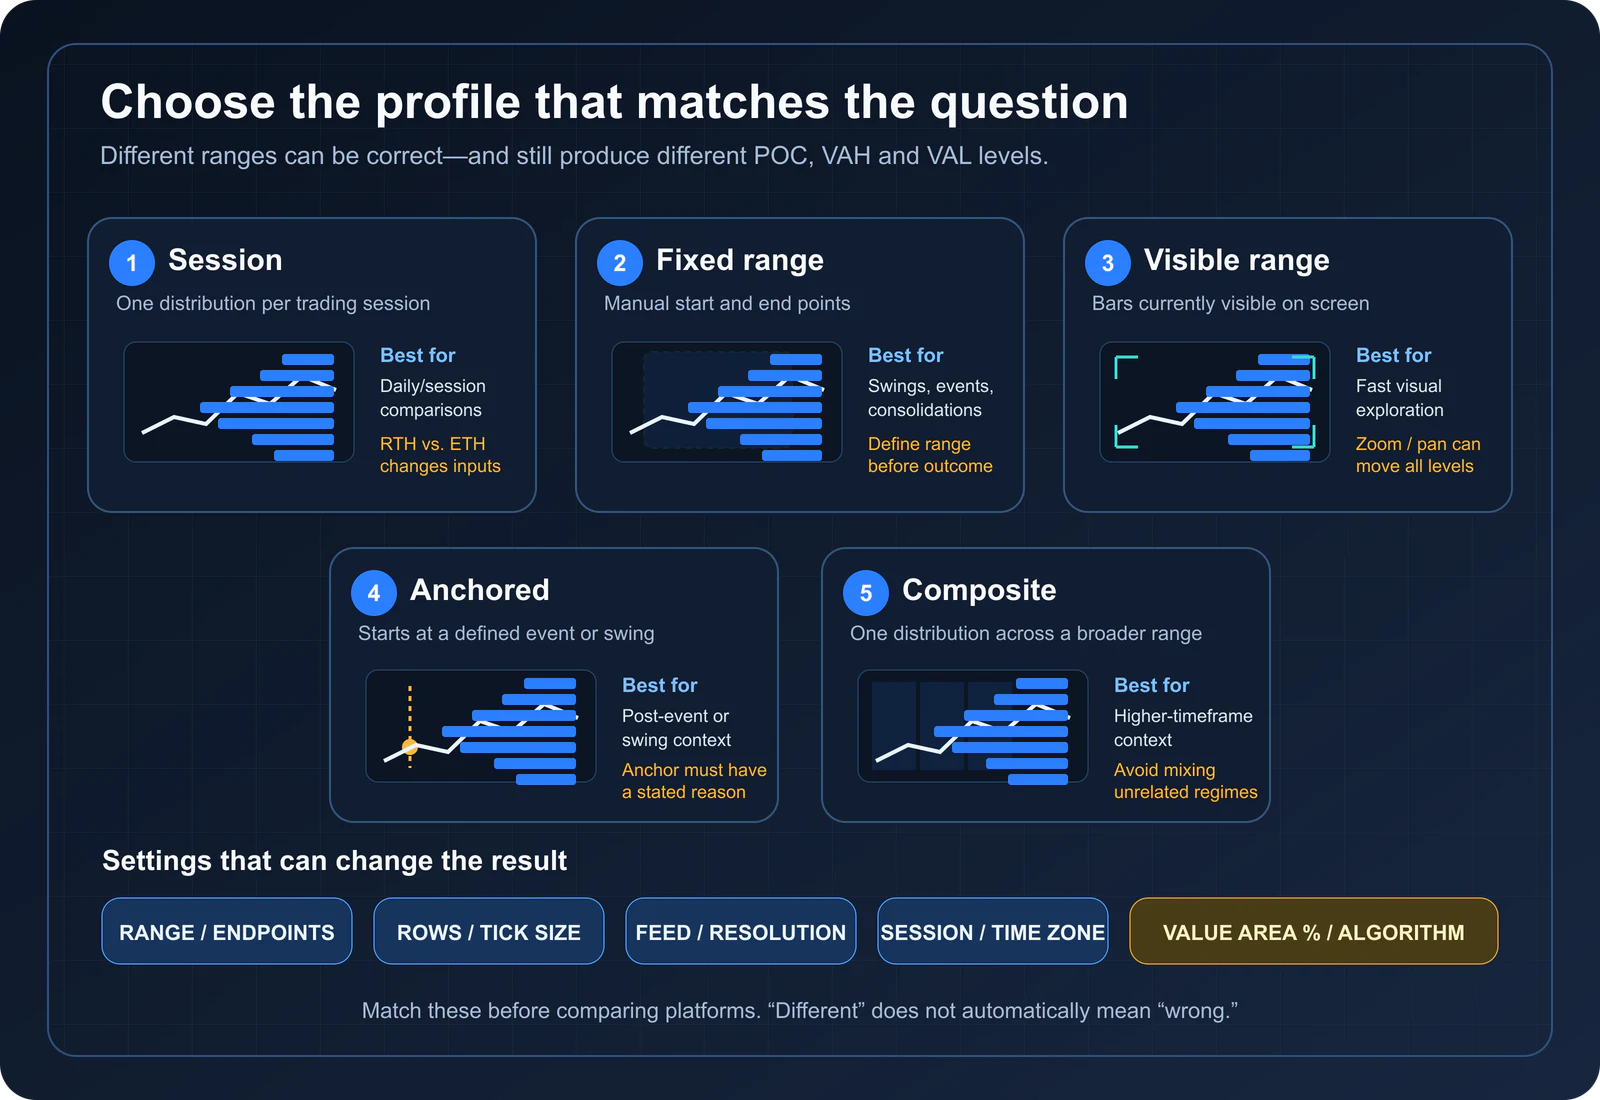
Session Volume Profile
A session profile creates a distribution for each session. Regular and extended hours can produce different levels.
Fixed Range Volume Profile
A fixed range profile isolates a swing, consolidation or event between manual endpoints. Choose the range by rule, not to fit a narrative.
Visible Range Volume Profile
A visible range Volume Profile calculates from the bars currently displayed. It is convenient for exploration, but it is dynamic: zooming or panning changes the data and can move the POC, VAH, VAL and nodes. TradingView explicitly documents this viewport-based behavior in its Visible Range Volume Profile guide.
Anchored Volume Profile
“Anchored” commonly describes a profile that begins at a meaningful event—such as a swing extreme, earnings release or breakout—and extends to the current bar or another selected endpoint. Platform terminology differs, and some anchored tools are implemented as fixed-range profiles whose endpoint is updated.
Composite Volume Profile
A composite combines a broader rule-defined range, such as multiple sessions. It can supply context while a session profile supports execution.
Best Volume Profile settings
There is no universal “best visible range Volume Profile setting.” The objective is stable, interpretable structure at a resolution appropriate for the instrument—not the maximum number of lines.
Use this starting process:
- Choose the analytical range first. Use a session for session questions, fixed range for a defined swing or event, and visible range for exploration.
- Match the session template. Decide whether regular or extended hours belong in the analysis.
- Start with the platform’s documented default row calculation. Then test a moderately finer and coarser setting.
- Keep levels only when the broad structure is stable. If a tiny row-size change completely reshapes the thesis, the observation is fragile.
- Use a documented value-area percentage. Seventy percent is a common convention; it is not mandatory.
- Save the template. Consistency makes review and testing possible.
One tick per row may be unreadable across a long range; large bins can merge distinct prices. Do not optimize against winning screenshots. Define the configuration before testing and include realistic costs.
How to read Volume Profile step by step
1. Define the market and range
Record the symbol or venue, time zone, session, profile type and endpoints. An undefined range is not reproducible.
2. Classify the broader context
Ask whether price is balancing, trending or transitioning. Note major structure, events and volatility; profile levels behave differently during rotation and repricing.
3. Locate price relative to value
Is price inside the value area, testing a boundary or established outside it? Where are the nearest high- and low-volume zones? Is the POC stable or migrating as the profile develops?
4. Form two conditional hypotheses
Write acceptance and rejection cases. For example: “Hold above VAH and retest: evaluate continuation. Close inside and fail to reclaim: evaluate rotation.”
5. Require observable confirmation
Confirmation might be a close, retest, swing-structure change or conventional-volume expansion defined in advance. A brief touch is not acceptance.
6. Define invalidation before entry
The trade thesis needs a price or market condition that proves it wrong. Stops should reflect that invalidation plus normal noise, not an arbitrary amount a trader hopes to risk.
7. Size the position and plan exits
Calculate position size from the allowed account risk and stop distance. Account for gaps, slippage, commissions and the possibility that a stop executes away from its trigger. Potential targets may include another profile boundary or node, but the expected reward must justify the risk before entry.
8. Record the profile configuration
Record the range, rows, value-area percentage, session and feed so the setup can be reviewed consistently.
Four Volume Profile trading strategies
These are conditional frameworks, not complete systems. Test each on the intended market and feed.
1. Value-area rejection
Context: A balanced or range-like market tests VAH or VAL from inside or just outside value.
Trigger concept: Price trades beyond the boundary but fails to build acceptance, returns inside value and confirms the failed excursion through the trader’s chosen price-action rule.
Invalidation: Price re-establishes acceptance outside value or breaks the structure that justified entry.
Potential objective: A developing POC, an HVN inside value or the opposite boundary, provided the reward-to-risk remains acceptable.
Avoid when: A strong news-driven move is building volume outside value, the market is opening with clear directional imbalance, or the profile boundary comes from an arbitrary range.
2. Value-area acceptance and breakout
Context: Price moves beyond VAH or VAL during directional conditions or after a mature balance.
Trigger concept: Price spends meaningful time outside the boundary, develops activity there, and holds a retest rather than immediately falling back into value.
Invalidation: A sustained return into the prior value area or failure of the breakout structure.
Potential objective: The next independently identified higher-timeframe node, prior range boundary or volatility-based target.
Avoid when: The “breakout” is only a single wick, liquidity is poor, or the target sits too close to compensate for the invalidation distance.
3. LVN rejection or rapid traversal
Context: Price approaches a clearly defined low-volume zone separating two larger areas of activity.
Trigger concept: Prepare for two alternatives. Rejection requires a failed test and structural confirmation near the LVN edge. Traversal requires acceptance into the thin zone plus momentum and room toward the next higher-volume area.
Invalidation: For rejection, acceptance through the LVN; for traversal, failure back out of the zone.
Potential objective: The adjacent HVN or another pre-defined structural level.
Avoid when: The LVN appears only at an extremely fine row setting, current volume is already filling the trough, or the next target offers inadequate reward.
4. HVN rotation or trend pullback
Context: In balance, an HVN may sit inside repeated two-way trade. In trend, a prior high-volume area may become a pullback reference.
Trigger concept: In balance, require evidence that rotation remains intact. In trend, require the pullback to hold the broader structure and resume in the trend direction.
Invalidation: Breakdown of the balance or trend condition that made the HVN relevant.
Potential objective: Another edge of value, a neighboring node or a structure-based target.
Avoid when: The trader is using “high volume” as proof of direction, the node comes from a stale regime, or risk must be placed inside ordinary noise.
Volume Profile shapes: D, P, b and B
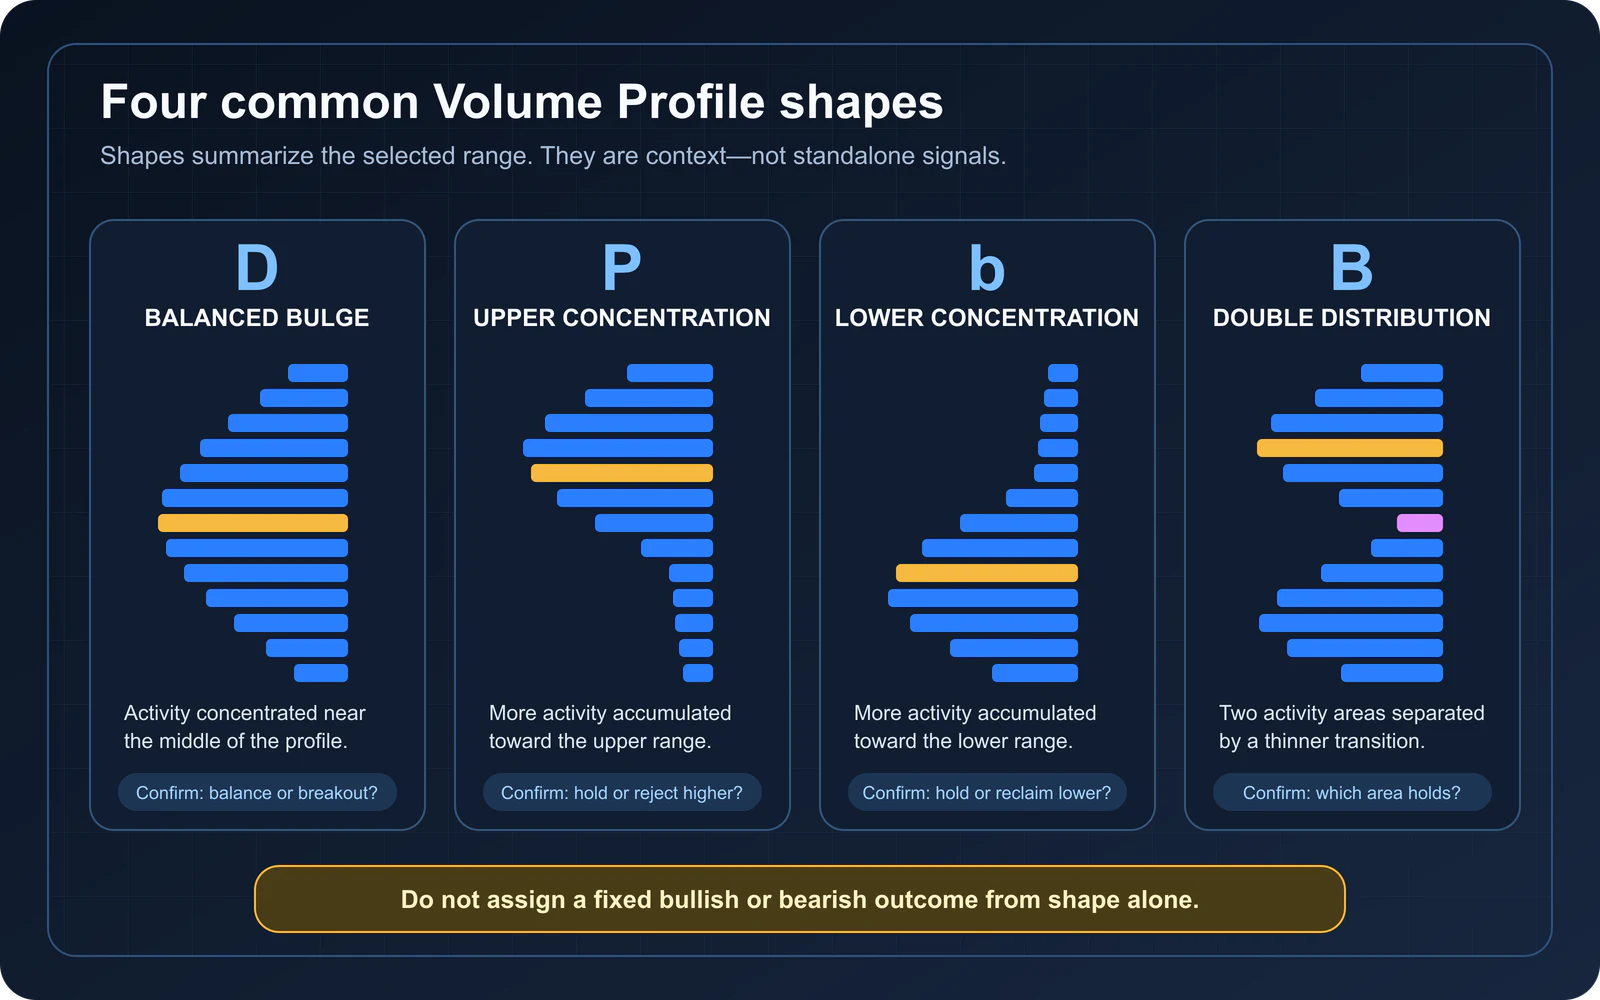
Profile shapes are compressed descriptions of a selected auction. These labels are practitioner shorthand, not standardized diagnostic categories, and should not be traded without context.
| Shape | Visual characteristic | Common description | What still needs confirmation |
|---|---|---|---|
| D | Broad bulge near the middle | Balanced, two-way activity | Whether balance will continue or break |
| P | Larger upper distribution with a thin lower stem | Sometimes associated with upward repricing or short covering, which the profile cannot verify | Whether higher prices hold or reject |
| b | Larger lower distribution with a thin upper stem | Sometimes associated with downward repricing or long liquidation, which the profile cannot verify | Whether lower prices hold or reclaim |
| B | Two distributions separated by a thinner area | Two areas of acceptance or a double distribution | Which distribution controls and whether the LVN holds |
The same shape can produce different outcomes. Total volume cannot separate acceptance, exhaustion or position-closing. Use later price behavior and broader structure, not a fixed directional label.
Volume Profile data by market
Futures
Exchange-traded futures provide reported contract volume at trade prices, but each delivery month is a separate instrument and activity migrates during rollover. Active-month and continuous-contract profiles can differ with stitching rules. Record the contract and rollover method.
U.S. stocks
For U.S. exchange-listed stocks, exchange trades and reported off-exchange executions—including ATS and dark-pool trades—are published on the consolidated tape. Unlisted OTC equities use separate FINRA reporting systems. Chart feeds and history can still differ. FINRA’s overview explains the landscape.
Spot forex and CFDs
Spot foreign exchange is an over-the-counter, decentralized market without one global consolidated volume tape, as described by the BIS. Retail platforms commonly show tick count or activity from a dealer or liquidity feed rather than total worldwide notional volume. The CFTC’s retail forex advisory notes that an OTC dealer controls the prices and information displayed on its platform. Forex Volume Profile can describe that feed, not the entire market.
CFD data can be similarly provider-specific. Check whether an indicator is using ticks, estimated volume or an underlying exchange feed.
Bitcoin and crypto
Crypto trading is split across exchanges, pairs and contracts; IOSCO describes fragmented price discovery across trading platforms. A BTCUSDT spot profile represents that venue and pair, not universal Bitcoin activity. Volume may not be comparable across exchanges unless units and methodology match.
Volume Profile platform guidance
Features and names change, so check current official documentation.
TradingView
TradingView’s Volume Profile documentation covers Fixed Range, Visible Range and Session variants. Check row layout, value-area percentage, lower-timeframe data and session inputs. Synthetic chart types can change how prices and volume are assigned.
Thinkorswim
Thinkorswim’s built-in VolumeProfile study uses its own configuration model. Its official reference documents price per row, time per profile, profile count, value-area percentage and expansion behavior.
This differs from TradingView’s explicitly viewport-based Visible Range tool. Verify the current Thinkorswim study’s behavior rather than assuming the platforms use identical ranges or calculations.
NinjaTrader
NinjaTrader’s Order Flow Volume Profile guide documents tick and minute resolution, configurable value area, session choices, composite profiles and fixed-range drawing tools. Confirm the selected resolution before comparing platforms.
MT4 and MT5
If you use a third-party MT4 or MT5 Volume Profile indicator, review its calculation method, source data, repainting behavior and time-zone assumptions. Check whether “volume” means ticks or broker-specific activity.
Are there free Volume Profile tools for beginners?
Access changes, so verify it on the official site. Schwab currently states that clients receive thinkorswim without a platform charge and offers a time-limited Guest Pass; its desktop study includes VolumeProfile. NinjaTrader offers free charting and simulation, but describes its built-in Volume Profile as part of the premium Order Flow+ suite. TradingView’s plan comparison lists native Volume Profile in paid plans. “Free platform” therefore does not always mean the specific profile feature or exchange data is free.
Volume Profile vs Market Profile, VWAP and other tools
| Tool | Organizes | Main question | Key difference |
|---|---|---|---|
| Volume Profile | Reported trade volume—or tick activity where that is the available input—by price | Where did activity concentrate? | Depends on feed, range and volume-at-price allocation |
| Market Profile / TPO | Time opportunities by price | Where did price spend time? | Measures time/price occurrence rather than volume |
| VWAP | Volume-weighted average price through time | What is the cumulative volume-weighted average? | Produces an evolving average line, not a distribution |
| Conventional volume | Volume by bar or time interval | When did activity expand? | Does not show the price distribution inside the chosen range |
| Footprint chart | Bid/ask or classified activity within bars | How was activity distributed inside each bar? | More granular and dependent on trade-classification data |
| Volume delta | Classified buying minus selling activity | Is aggressive activity imbalanced under the chosen method? | Attempts directional classification; total Volume Profile does not |
Volume Profile and Market Profile are frequently confused because both can display POC and value-area concepts. TradingView’s TPO documentation explains the central distinction: TPO counts time-price opportunities, while Volume Profile accumulates volume.
Common Volume Profile mistakes and limitations
- Treating levels as automatic entries. POC, VAH, VAL, HVNs and LVNs need current confirmation and a defined invalidation.
- Changing the range after seeing the outcome. Range selection should follow a rule, not a desired level.
- Ignoring developing levels. Intraday POC and value boundaries can migrate as new trades arrive.
- Comparing mismatched profiles. Different feeds, sessions, contracts and bins can produce different but internally valid results.
- Assuming volume reveals “smart money.” Total volume records completed activity, not participant identity or directional intent.
- Using visible range as a stable anchor. Zooming and panning can change viewport-based calculations.
- Overfitting settings. A configuration selected from winning screenshots may fail out of sample.
- Ignoring execution costs. Spread, commission, slippage and gaps can erase an apparent chart edge.
- Using unreliable market data without disclosure. Forex and crypto profiles are often feed- or venue-specific.
- Expecting a universal win rate. A tool is not a fully specified strategy.
What is the Volume Profile win rate?
There is no defensible universal Volume Profile win rate. Results depend on the exact setup, market, timeframe, data feed, profile range, trigger, stop, target, costs, sample period and test method. A claim that “Volume Profile wins 70% of the time” is meaningless unless all of those rules and the complete dataset are disclosed.
To evaluate a strategy, define rules first, include losing and skipped trades, use realistic costs, separate development from out-of-sample evaluation, and report sample size, expectancy and drawdown. A risk-of-ruin calculator can stress-test win-rate, payoff and risk assumptions, but only with realistic inputs. Win rate alone cannot establish an edge.
Volume Profile FAQ
What does Volume Profile tell you?
It shows activity assigned to price rows within a selected range, including POC, value area, concentrations and troughs. It does not predict direction.
What are POC, VAH and VAL?
POC is the highest-volume row. VAH and VAL are the value area’s upper and lower boundaries. All depend on the selected data, range and settings.
What do HVN and LVN mean in trading?
An HVN is a relative peak; an LVN is a relative trough. They can frame rotation, transition or rejection hypotheses, but neither guarantees a reaction.
Is 70% always the correct value-area setting?
No. Seventy percent is a common, configurable convention—not a natural law. Use a documented setting consistently.
What are the best visible range Volume Profile settings?
There is no universal best setting. Match the range, session and feed to the question, then compare finer and coarser rows. Prefer structure that remains stable.
Does Volume Profile repaint?
A developing profile changes with new volume; visible range also changes with the viewport. A completed fixed range stays stable if data and settings do, apart from feed corrections.
Can Volume Profile be used for forex?
Yes, but the input is usually tick activity or broker-specific data, not total global spot volume. Results can differ between brokers.
Can Volume Profile be used for Bitcoin?
Yes, but exchange, pair and instrument matter. Spot, perpetual-futures and aggregated profiles answer different questions.
Is Volume Profile the same as Market Profile?
No. Volume Profile distributes reported trade volume—or tick activity where that is the available input—by price; Market Profile/TPO distributes time-price opportunities.
Are free Volume Profile tools accurate?
Accuracy depends on calculation, feed quality, history and settings—not price alone. Check what “volume” means, how rows are built and whether the viewport changes them. See the platform section for current official access routes.
Which timeframe is best for Volume Profile?
Range and data resolution matter more than one chart timeframe. A composite can provide context while a session or fixed range supports execution, if both are defined consistently.
Editorial methodology and risk disclosure
This guide separates documented indicator mechanics from practitioner interpretations. Definitions and platform behavior were checked against primary documentation from TradingView, Thinkorswim, NinjaTrader, Sierra Chart, CME Group and regulators. Cross-platform levels may differ because ranges, feeds and algorithms differ. Strategy examples are hypothetical and educational; they are not performance claims or records of actual trades.
Production transparency: AI tools assisted with research organization, draft development and the featured illustration. Amin Ghalebi personally reviewed the final article, checked its claims, sources, chart labels and platform descriptions, and approved it for publication on July 27, 2026.
Risk disclosure: Trading involves substantial risk. Profile levels can fail, stops can execute away from their trigger, and margin or leveraged products can produce losses greater than the initial deposit. This is general education, not personalized financial, investment or trading advice. Test independently and use only risk capital. Review FINRA’s day-trading disclosure and the CFTC’s risk-capital guidance.
Primary sources and further reading
- TradingView: Volume Profile indicators—basic concepts
- TradingView: Volume indicator
- TradingView: Fixed Range Volume Profile
- TradingView: Visible Range Volume Profile
- TradingView: Session Volume Profile
- TradingView: Time Price Opportunity
- Thinkorswim: VolumeProfile study reference
- NinjaTrader: Order Flow Volume Profile
- Sierra Chart: Volume by Price
- CME Group: What is volume?
- FINRA: Where do stocks trade?
- CFTC: Eight things to know before trading forex
- BIS: FX execution algorithms and market functioning
- IOSCO: Issues, risks and regulatory considerations relating to crypto-asset trading platforms
- CFTC: Trade with risk capital
- FINRA: Day-trading risk disclosure statement